Easygraph
Easygraph
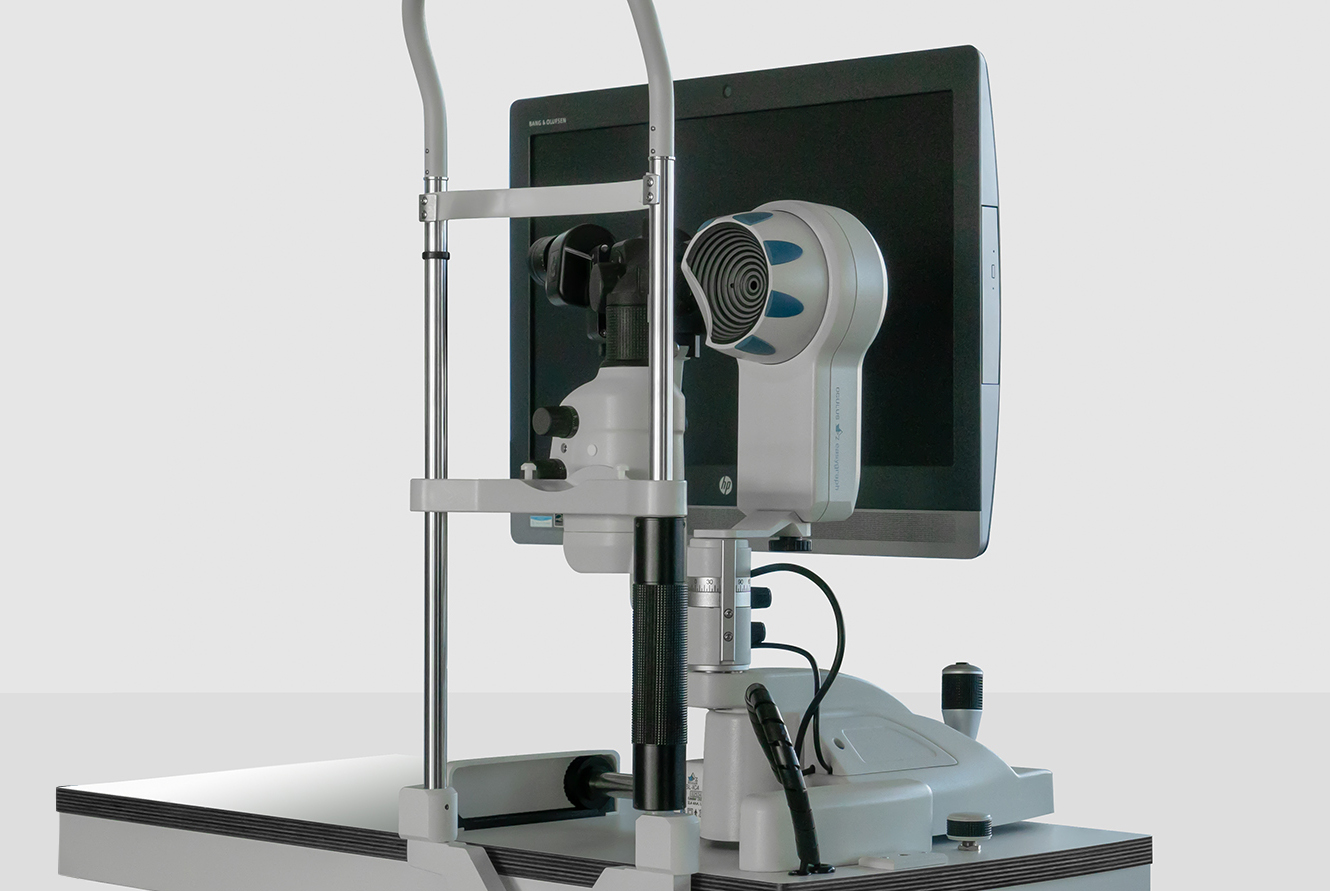
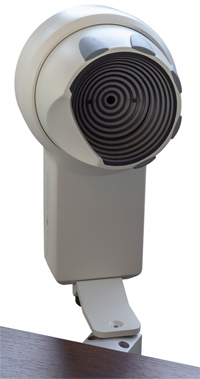
Easygraph to miniaturowa wersja znanego topografu firmy Oculus. Urządzenie pozwala na stworzenie dokładnej mapy topograficznej i keratometrycznej przedniej powierzchni rogówki oka. Bogate oprogramowanie pozwala na analizę otrzymanego obrazu i wykorzystanie do wielu praktycznych zastosowań. Możliwość zamocowania aparatu na korpusie lampy szczelinowej, niewielkie wymiary, prosta obsługa i niezawodne oprogramowanie pozwala na stosowanie aparatu w gabinetach okulistycznych i salonach optycznych, do diagnostyki rogówki np. ocenie deformacji rogówki z analizą i oceną stożka rogówki, przy kwalifikacji do zabiegów refrakcyjnych, a także do dobierania soczewek kontaktowych (wbudowany program dobierania soczewek firmy Hecht).
The Easygraph – The Small Performance Wonder
The Easygraph works with the tried and tested measuring and device technology that has become indispensable in today’s contact lens fitting and reliable diagnostics fields. Ideal where space is limited.
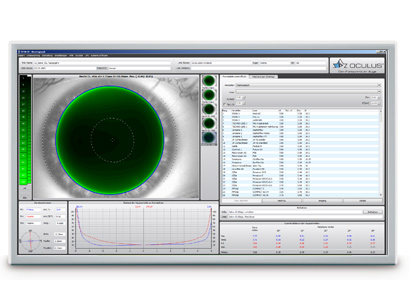
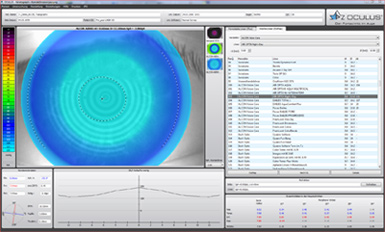
Contact Lens Fitting and Fluorescein Image Simulation
A list of recommended contact lenses available from well-known manufacturers is generated based on your patient’s corneal topography data. Prior to fitting, fluorescein images can be simulated and adjusted (rotate, offset, change parameters).
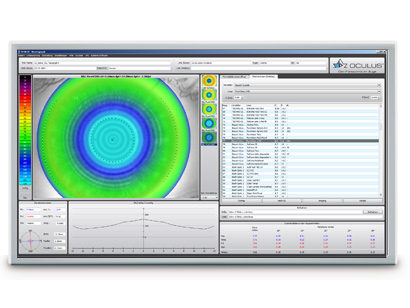
OxiMap® – Visualization of the Oxygen Transmissibility of Soft Contact Lenses
Easy to understand OxiMap® presents a color map of the oxygen transmissibility of soft contact lenses based on the lens power, which is easy to understand – even for your customers!
Compact Corneal Topographer
The Easygraph combines small construction with grand technology. The tried and tested measuring system is identical to that of the keratograph. This compact topographer is a combination of a topography system and an integrated keratometer. In the non-contact examination process, 22 000 measuring points are used to map the cornea. Digital image transmission and automatic release guarantee the best possible reproducibility.
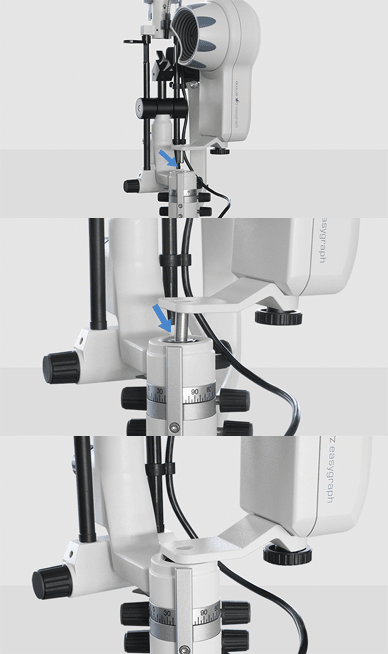
Simple Mounting on the Slit Lamp.
The Easygraph comes complete with a slit lamp adapter and holder. These make it easy to move the Easygraph from the work position to the idle position. After using the Easygraph, you can resume the examination with the slit lamp as normal.
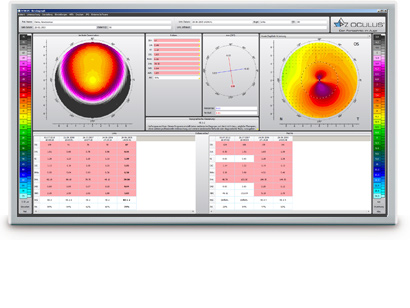
Precise Measurement, Easy-to-Understand Presentation
Precise measurement is the basis for many types of analysis. Graphic presentation of the data supports you in the evaluation and quantitative assessment of the corneal topography:
- Overview with camera image and color map
- 3D and 2D display
- Various color maps
- Plot of the Fourier analysis
- Refractive map
- Height map of the topography data
- Map of the sagittal and tangential radii
- Comparison of different examination results for follow-up purposes
Contact Lens Fitting
The topography data provide the contact lens fitter with comprehensive support, whether he is a specialist or a newcomer to the job. The first placement of the contact lens and initial checking of the fit take place without any actual physical contact – simulated on the PC. This saves time and paves the way to the ideal contact lens for the patient. For hard contact lenses, a fluo-image is simulated based on the topography and the contact lens data. The contact lens can be moved with the click of a mouse, and can be rotated too for optimal fitting of toric contact lenses. After the virtual contact lens has been positioned on the real eye, the fluo-image simulation is recalculated and can be compared with realistic, static and dynamic images.

Progression Follow-up Diagnostics
Regular progression follow-ups are essential, not only for cases of keratoconus. In the „Compare examination“ display, up to four examinations can be directly compared with each other and any changes of the corneal topography can be displayed with color-coding.
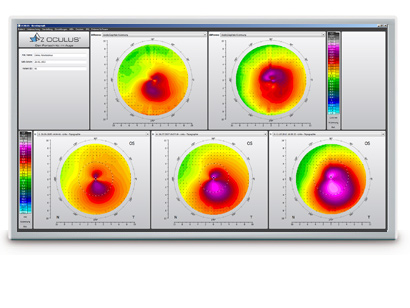
Display of Refractive Corneal Changes
Changes in the refractive power of the cornea as a resulting of wearing of Ortho-K contact lenses or of refractive surgery can be analyzed and documented.
Keratoconus Detection at the Highest Level
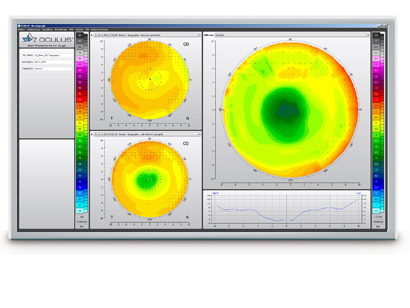
Thanks to topography measurement, corneal abnormalities can often be detected and diagnosed in the early stages. The measurements are compared with those in a norm database. If abnormalities are present, the measured values are displayed in yellow or red. If a keratoconus is present, it is classified based on the existing topography. The Topographic Keratoconus Screening also helps you in progression follow-ups and where applicable, shows you whether and how the keratoconus has changed.
Zernike-Analysis
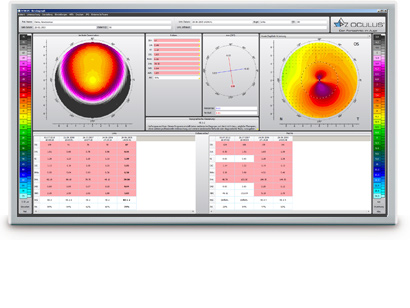
Corneal abnormalities can be displayed in 2D and 3D using the Zernike Analysis. The displayed aberration coefficient provides information about the optical image quality of the cornea. In addition to this corneal wavefront analysis, the software also marks the location of the apex and is easy for the user to recognize.
OCULUS OxiMap®
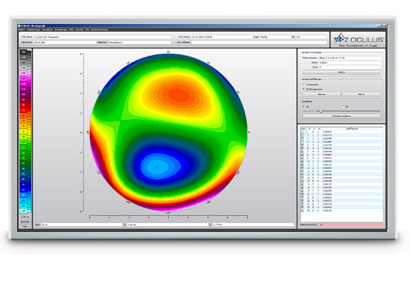
The OxiMap® presents a color map of the oxygen transmissibility of soft contact lenses based on the lens power, which is easy to understand – even for your customers!
How Much Oxygen Really Reaches the Cornea?
Until now, only the oxygen transmissibility values for the center of a contact lens with -3.0 D were available. The OxiMap® shows the oxygen transmissibility depending on the lens material and the lens thickness. The OxiMap® is available for the most frequently sold spherical soft contact lenses. This impressive tool assists you in helping your patients select the most suitable contact lens.
Plain and Comprehensive Visualization Assures Patient Loyalty!
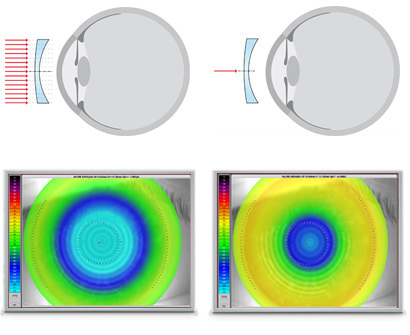
Contact lenses act as a potential barrier to oxygen transport even when the eyes are open to the atmosphere. Long hours of wearing comfort can only be guaranteed with a sufficient oxygen supply. The color representation of the various terms of oxygen transmissibility is based on international recommendations for daily, extended and continuous wear.
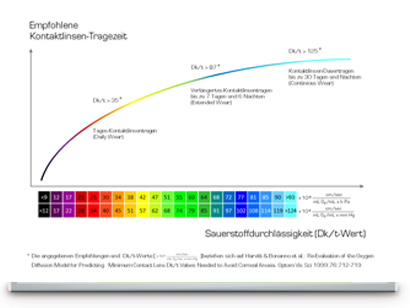
Compare Different Soft Contact Lenses!
The OxiMap® is individually adapted based on the lens power and supports you in your consultation with the patient and helps you to choose the most suitable contact lens. New materials used for soft contact lenses provide excellent oxygen transmissibility.
OxiMap® was developed in close cooperation with JENVIS Research and the University of Applied Sciences in Jena.
| Measuring range | 3 – 38 mm, 9 – 99 dpt |
| Accuracy | ± 0.1 dpt |
| Reproducibility | ± 0.1 dpt |
| Number of rings | 22 |
| Working distance | 40 mm |
| Number of test points | 22 000 |
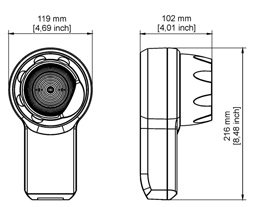
| Dimensions: W x D x H | 119 x 102 x 216 mm (4.7 x 4.0 x 8.5 in) |
| Weight | 730 g (1.6 lbs) |
| Power supply unit | Input: 100 – 240 V Output: 5 V / 1 A |
| PC Minimum requirements | Processor: Intel® Core™ i5-6600, 8 GB RAM, 500 GB HDD, Windows® 10 Pro |


